
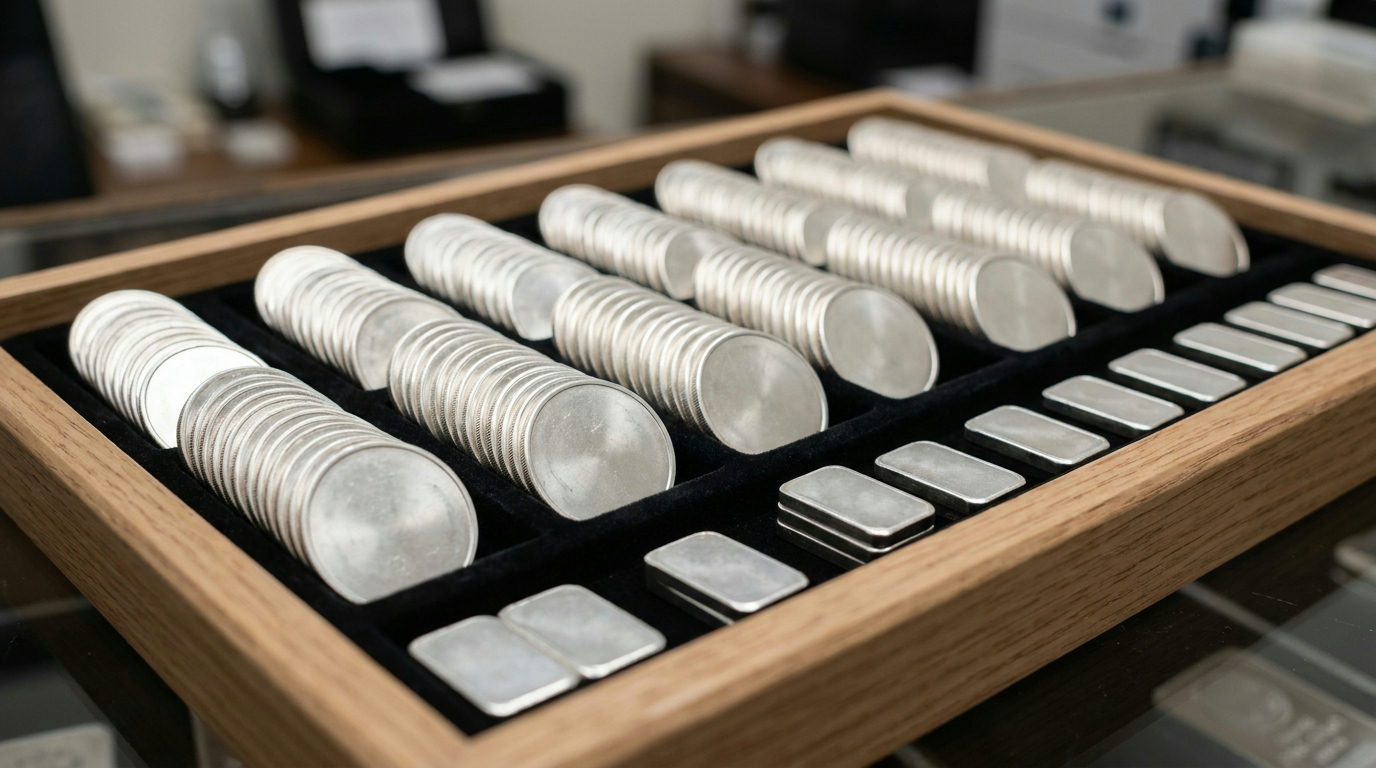
Coins and bars are how many individual investors hold silver. Their demand can swing sharply from year to year, and it often reveals how retail buyers feel about the metal. This guide explains what silver coin and bar demand measures, what the latest data shows by region, and how to read it alongside other signals.
What coin and bar demand measures
The Silver Institute’s World Silver Survey tracks “physical investment”, meaning silver bought as bullion coins and bars. It reports this as coin and net bar demand. “Net” means bar sales minus bars sold back, so heavy selling by existing holders reduces the figure.
Silver coin and bar demand in 2025
According to the World Silver Survey 2026, coin and net bar demand rose 14% in 2025, after two consecutive years of decline. However, the picture differed sharply by region.
| Region | 2025 trend |
|---|---|
| India | Up 33%, the strongest gain |
| Europe | First rise in three years |
| Middle East and China | Multi-fold gains from a low base |
| United States | A third consecutive year of losses |
Source: World Silver Survey 2026, as reported by Mexico Business News (May 2026).
Why the US moved differently
According to the survey, US demand fell for a third straight year. It cited reduced safe-haven buying after the 2024 US election. In addition, it pointed to profit-taking, as existing holders sold into the price rally, especially in the first nine months of 2025. Because the figure is net of selling, strong buyback activity pulled US demand down even as prices rose.
For context, the USGS estimated that in the US in 2025, net physical investment in bars accounted for 18% of silver use, and coins and medals for 14%.
The 2026 outlook
The survey forecast coin and net bar demand to jump about 18% in 2026. That would help offset expected falls in jewellery and industrial demand. As always, however, this is a forecast from one research house, not a certainty.
How to read silver coin and bar demand
- Look at regions. Global totals can hide very different trends, as 2025 showed.
- Remember it is net. A fall can mean more selling back, not just fewer purchases.
- Watch premiums. Rising premiums over spot often signal strong retail demand. See our guide to the silver premium over spot.
- Compare with funds. ETF flows are a separate part of investment demand. Our guide to silver ETF holdings explains them.
Frequently asked questions
Did silver coin and bar demand rise in 2025?
Yes. It rose 14% globally, according to the World Silver Survey 2026, after two years of decline.
Which country led silver bar and coin buying in 2025?
India, where demand rose 33%, according to the survey.
Why did US silver coin and bar demand fall?
The survey cited weaker safe-haven buying and heavy profit-taking by existing holders during the price rally.
What does “net bar demand” mean?
It is bar purchases minus bars sold back. Strong selling by holders lowers the figure.
Sources
- Mexico Business News: World Silver Survey 2026 (May 18, 2026)
- SilverTrade: The Silver Institute releases 2026 World Silver Survey (April 15, 2026)
- USGS: Mineral Commodity Summaries 2026, Silver (February 2026)
This article is general information, not financial advice. Survey figures are estimates and may be revised. Forecasts may not come true.
Written and reviewed by the SilverPriceCharts.com editorial team. Sources are linked above.