
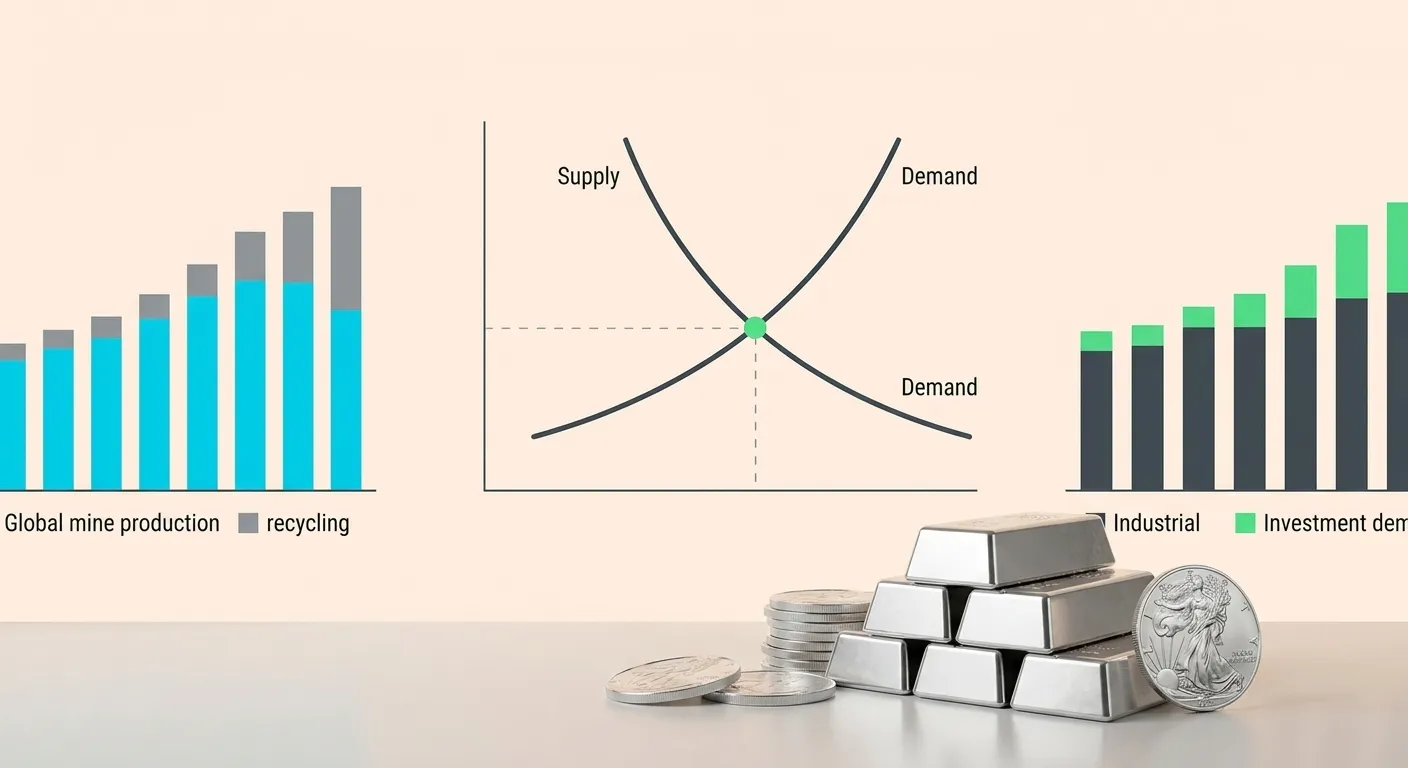
Every year, analysts add up how much silver the world produced and how much it used. The difference is the market balance, and it is one of the most watched numbers in the silver market. This guide explains how silver supply and demand are measured, what the latest figures show, and how to read a “deficit” without over-reading it.
Who measures silver supply and demand?
The main reference is the World Silver Survey, published each April by the Silver Institute and researched by the London consultancy Metals Focus. It estimates every source of supply and every category of demand for the previous year, and it gives a forecast for the current year.
Because no one can observe every ounce, the figures are estimates built from company reports, trade data, industry surveys and fieldwork. They are also revised as better data arrives. So treat any single number as a best estimate, not an exact count.
The silver balance in 2025
| Item | 2025 estimate | Change vs 2024 |
|---|---|---|
| Mine production | 846.6 million oz | Up 3% |
| Recycling | 197.6 million oz | Up 2% |
| Total supply | 1,090.4 million oz | Up |
| Industrial demand | 657.4 million oz | Down 3% |
| Total demand | About 1.13 billion oz | Down 2% |
| Market balance | Deficit of 40.3 million oz | Fifth deficit in a row |
Source: Silver Institute and Metals Focus, World Silver Survey 2026 (April 2026), as reported by SilverTrade and Investing News Network.
Where silver supply comes from
Mine production is the largest source. According to a summary of the survey, output rose in Peru and Chile in 2025, while Mexico’s fell. Only about 26% of mined silver came from primary silver mines. The rest was a by-product of mining lead, zinc, copper and gold.
Recycling is the second source. It rises when prices are high, because people sell old jewellery, silverware and scrap. In 2025, recycling reached a 12-year high, according to the survey.
Because most silver is a by-product, supply does not respond quickly to the silver price. That is a key reason the market can stay in deficit for several years.
Where silver demand goes
- Industrial uses, such as electronics, solar panels and vehicles, are the largest category. On the survey’s figures, they made up roughly 58% of total demand in 2025.
- Jewellery and silverware are a significant share and are sensitive to price. High prices tend to cut this demand.
- Coins and bars reflect investor buying. This category rose 14% in 2025, according to the survey.
- Exchange-traded products can add or release large amounts of metal, depending on investor flows.
What a silver deficit means, and what it does not
A deficit means total demand was higher than total supply in a year. The gap is covered from existing above-ground stocks, such as metal in vaults and inventories. The survey recorded a fifth consecutive deficit in 2025.
However, a deficit does not mean the world is running out of silver. Large stocks exist above ground. Instead, repeated deficits gradually reduce the metal that is readily available, which can tighten the physical market over time. In addition, a deficit does not guarantee a higher price. Price depends on how much of the available stock owners are willing to sell.
The 2026 outlook, as forecast in April
The survey forecast a sixth consecutive deficit in 2026, of about 46.3 million ounces. It expected total demand to fall about 2%, with industrial demand down around 3%, mainly because solar manufacturers are using less silver per panel. Meanwhile, it expected coin and bar demand to rise about 18%, and mine production to stay roughly flat.
These are forecasts from one research house, not certainties. Actual results can differ, and the figures are likely to be revised.
How to read silver supply and demand data
- Check the year and the edition. Figures for the same year change between editions.
- Look at the components, not just the headline balance. A deficit caused by investment buying behaves differently from one caused by industrial demand.
- Compare the deficit with the size of above-ground stocks, not just with annual supply.
- Remember that price reflects many factors beyond the annual balance. Our guide to what drives silver prices covers them.
Frequently asked questions
Is silver in a supply deficit?
According to the World Silver Survey 2026, the market recorded a fifth straight deficit in 2025 and was forecast to post a sixth in 2026.
Where does most silver come from?
Most comes from mines, and most mined silver is a by-product of lead, zinc, copper and gold mining. Recycling is the second main source.
What uses the most silver?
Industry uses the most, including electronics, solar panels and vehicles. It accounted for roughly 58% of demand in 2025.
Does a deficit mean silver prices will rise?
Not necessarily. A deficit is covered from existing stocks, and price depends on many other factors, including investment flows and the dollar.
Sources
- SilverTrade: The Silver Institute releases 2026 World Silver Survey (April 15, 2026)
- Investing News Network: Silver Institute forecast (April 27, 2026)
- Mexico Business News: World Silver Survey 2026 (May 18, 2026)
This article is general information, not financial advice. Survey figures are estimates and may be revised. Forecasts are the views of their authors and may not come true.
Written and reviewed by the SilverPriceCharts.com editorial team. Sources are linked above.